Example #1
Graph of the Point 2

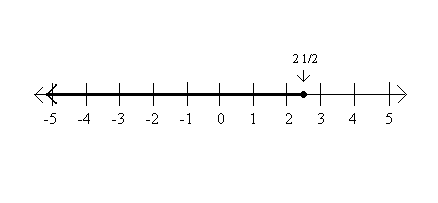
The following graph represents the inequality x≤2
 . The dark line represents all the numbers that satisfy x≤2
 . If i pick any number on the dark line and plug it in for x , the inequality will be true.
Example #2
Graph of the Inequality x≥2

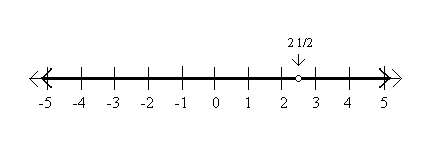
An inequality with a " ≠ " sign has a solution set which is all the real numbers except a single point (or a number of single points). Thus, to graph an inequality with a " ≠ " sign, graph the entire line with one point removed. For example, the graph of x≠2 looks like:
 looks like:
No comments:
Post a Comment